 eAtlas Data Catalogue
James Cook University (JCU) TropWATER Centre MangroveWatch Hub
Type of resources
Topics
Keywords
Contact for the resource
Provided by
Update frequencies
status
-
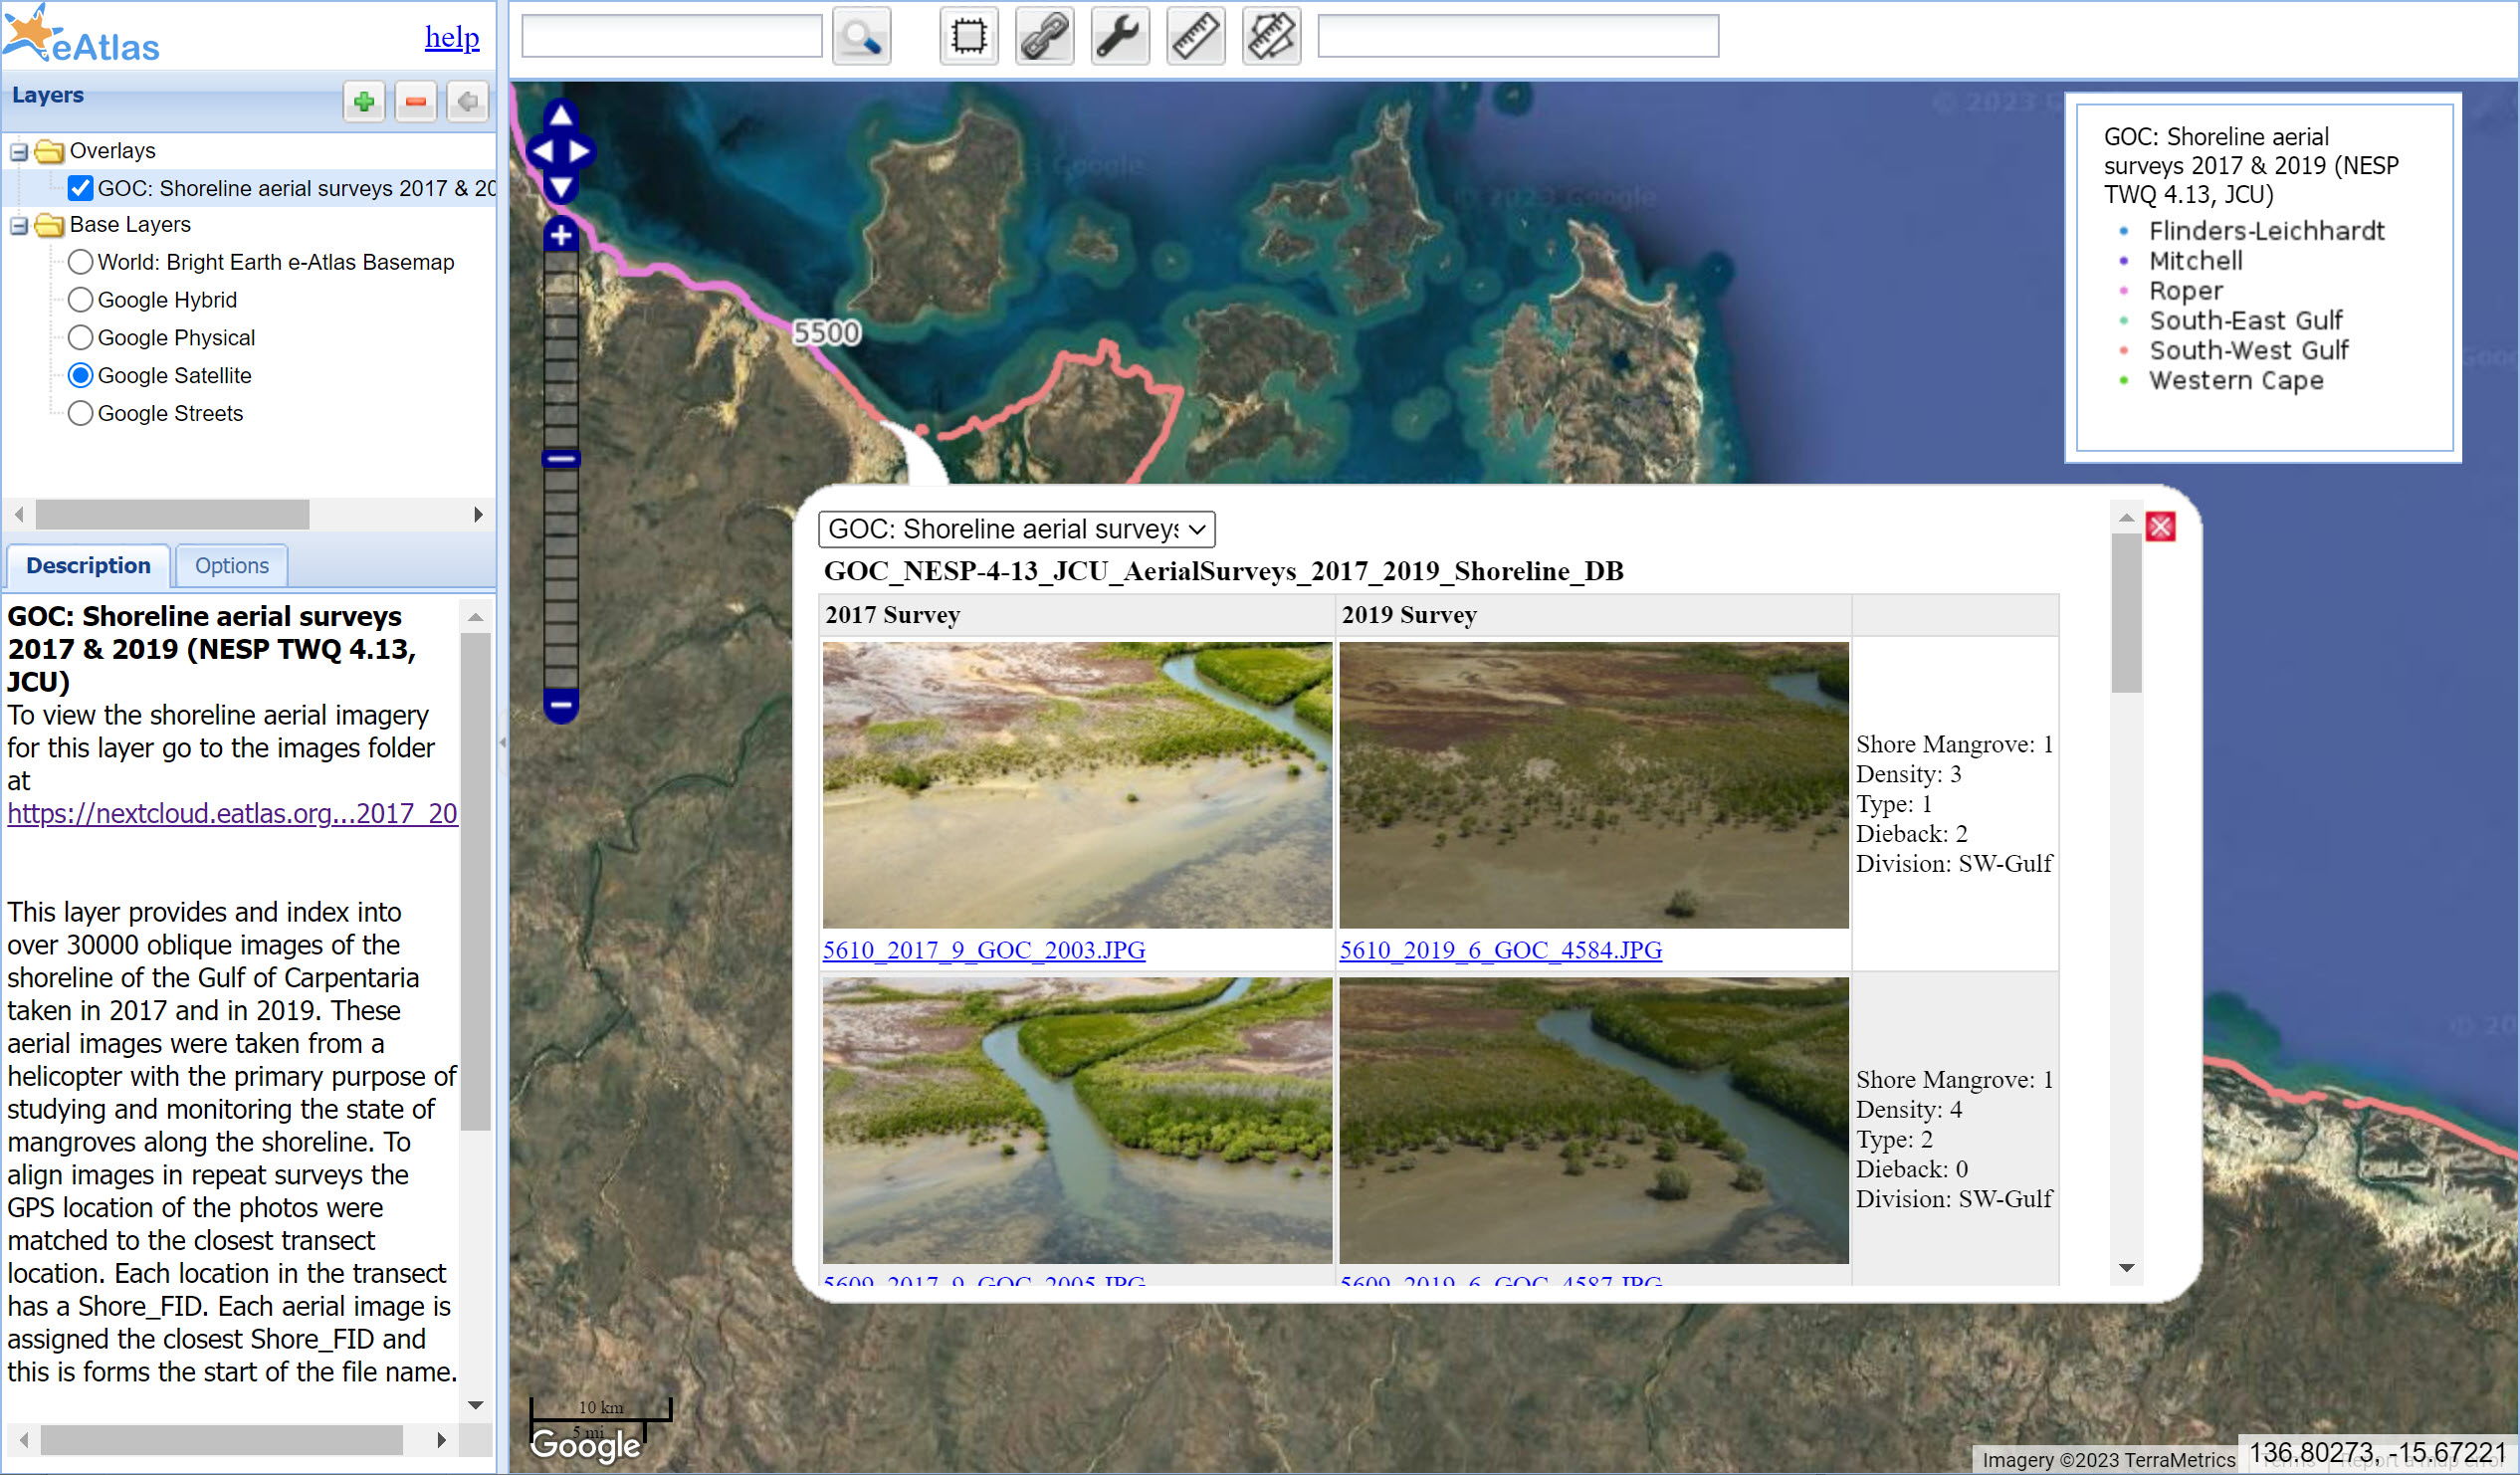
This project investigated the cause of the extensive areas of mangroves across the Gulf of Carpentaria which died in late 2015. Images from local fisherman showed extended impacted areas of more than 1,000 km where at least 7,400ha of mangroves had died in a matter of months. The project mapped the extent of the mass die-back, conducted aerial surveys to quantify shoreline condition, field studies to validate remote assessments and engaged with local aboriginal ranger groups to raise capacity for monitoring. The imagery can be viewed via a map interface https://maps.eatlas.org.au/index.html?intro=false&z=10&ll=136.96547,-15.79844&l0=ea_nesp4%3AGOC_NESP-4-13_JCU_AerialSurveys_2017_2019_Shoreline_DB,google_HYBRID or viewed as a gallery and downloaded in bulk https://nextcloud.eatlas.org.au/apps/sharealias/a/GOC_NESP-4-13_JCU_Mangrove-Shoreline-Aerial-Surveys_2017_2019 The aerial surveys are the first comprehensive record of oblique and continuous views of coastal shorelines for this large section of the Gulf of Carpentaria – providing a working database of more than 30,000 high-resolution images. This record is a lasting primary reference for baseline visual characterisations of shorelines for 2017 and 2019. The aim of aerial shoreline surveys was to systematically record and investigate the presence of 2015 mangrove dieback, the overall condition of shorelines, processes affecting the mangrove vegetation, and the health of tidal wetlands along Gulf shorelines, as well as in the mouths of major estuarine systems. These surveys were repeated in 2017 and in 2019 to gain insight and knowledge of the issues affecting shorelines, and the severity of factors influencing Gulf shorelines. The aerial surveys provided a baseline database or library of more than 19,534 geotagged oblique locations in 2017 and 2019 covering every metre of shoreline plus a series of inland profiles extending to the upper limits of tidal inundation in 37 estuarine outlets. This dataset consists of the complete set of imagery and compiled observations of current drivers of change and severity of impacts for 37 major estuarine sites. From east to west, these sites included Mission River, Embley River, Watson River, Holroyd River, Christmas Creek, Mitchell River, South Mitchell River, Nassau River, Staatan River, Gilbert River, Accident Inlet, Norman River, Flinders River, Leichhardt River, Albert River, Nicholson River, John’s Creek, Syrell Creek, Massacre Inlet, Dugong River, Toongoowahgun River, Elizabeth River, Sandalwood Place River, Calvert River, Robinson River, Wearyan River, McArthur River, Mule Creek, Limmen Bight River, Towns River, Roper River, Miyangkala Creek, Rose River, Muntak River, Walker River, and Koolatong River. (Note: we are still to publish the estuary survey data on the eAtlas). Shoreline and estuarine evaluations identified more than 30 issues in tidal wetland and shoreline habitats divided into direct and indirect human causes, or natural causes: shoreline retreat & landward transgressions of saline water and tidal wetland vegetation, rising sea levels, severe and frequent storms, feral animals plus other seemingly uncontrolled but damaging local land management practices. Methods: Aerial surveys were conducted in two series during 2017 and 2019. Those in 2017 were completed over 11 days from 1–11 December and included the shoreline survey plus surveys of 37 estuary mouths. The shoreline distance surveyed in 2017 was 2,633 km with a total flying distance of 4,646 km over 173 hours. A follow-up survey in 2019 was completed over nine days from 12–21 September and included the shoreline survey plus surveys of 31 estuary mouths. Aerial surveys were made using an R-44 helicopter flying at around 150 metres altitude. The aircraft windows and doors were removed to aid easier and best quality image capture. The entire shoreline from Mission River at Weipa (Queensland) to Koolatong River in Blue Mud Bay (Northern Territory) was surveyed. Shoreline and target estuaries were assessed in their order of occurrence travelling in a westerly direction. Shoreline filming captured the complete coastline used in the current evaluations of shoreline and estuarine habitat condition, with geotagged high-resolution digital images of shorelines, taken obliquely at low elevations ~150 metres altitude.. These photographs were comprised of three categories of images – survey, scenic and general. Survey photos made up ~60% and consisted of high-resolution images using a Nikon D800E camera with AF-S Nikkor 50 mm 1:1.4 G-series lens and di-GPS. These images were taken to give overlapping continuous coverage of shorelines centred up from the mean sea level contour – as the seaward edge of mangroves. Scenic photos made up ~33% and consisted of high resolution images using a Nikon D850 camera with AF-S Nikkor 28–300 mm 1:3.5–5.6 Gseries and di-GPS. A similar number and types of images were acquired in 2019. Summary of scenic photos: 2017 survey: Day 1: R44 Helicopter and crew on ground, jabiru in flight, crocodile on beach Day 2: Aerial view of mangrove die back, feral pigs on beach, jabiru in flight, large flock of egrets in mangrove forest Day 3: Aerial view of snubfin dolphin at surface, mangrove die back, smoke plume from bush fire in the distance creating a cloud, helicopter taking off. Day 4: Close up of rubber vine in a mangrove, pelican in flight, aerial image of swimming crocodile in turbid water with fish in its mouth, aerial shot of salt pans, crab pot on a mud flat. Day 5: Dead patch in mangrove forest due to lightning strike, aerial photos of mangrove die back, seagrass (long thin), aerial image of a dugong feeding trail through a seagrass meadow. Day 6: Indigenous coastal fish traps, sea eagle in flight, dugong stranded in mud, jabiru walking on sand, aerial photos of mangrove die back, shorebirds in flight Day 7: Dingy upside down on remote beach, aerial view of lush highly dense seagrass meadow (2 species, one with long leaves), dingy stranded in middle of mangrove forest, dark grey heron flying low over a river, fringing coral reef?, sea turtle, bent aero plane propeller partly covered in oysters, ghost net on shore Day 8: Large vertebra bone (whale?) on salt pan, turtle, helicopter in flight, aerial view of river mouth with seagrass meadows, Norm Duke standing in water holding seagrass Day 9: Large wrack of seagrass (tubular leaves), shore bird, mangrove die back, crocodile swimming with head out of water, boat ramp with two vehicles, industrial harbor, areas with large mangrove die back Day 10: Stranded dingy, aerial view of four green turtles, mangrove forest with large flock of black birds, ghost net caught up in mangrove, egret in flight over water, helicopter taking off from near mangrove, small town, aerial view of area with dense seagrass meadow Day 11: Closeup of water buffalo walking through water with long leafed seagrass, aerial view of 10 water buffalo, possibly indigenous fish traps, small town, river mouth with dense seagrass, large areas of mangrove die back 2019 survey: 0_sortedPhotos: images sorted by categories: Burdekin duck, crab pots, crocs, depositional gain, erosion, fire, inner fringe collapse, jabiru, jellies, large litter, light gaps, pelicans, root burial, shorebird Day 11: Ghost nets Day 12: Crocodile on mud flat, eight pelicans floating on water, pair of jabiru, collection of large tires on the shoreline presumably to help catch fish or crabs, samphire on a salt pan, helicopter in flight, crab pot at the edge of a mangrove, small boat wreckage on dry land at edge of mangrove, mangroves with fire in the distance, ghost nets on a beach, red dirt cliff where the shore is receding, weathered dead mangrove stumps, aerial shot crocodile swimming in clear water, aerial shot of wide sandy beach, two dead sharks on beach presumably caught and abandoned, jabiru in flight, flock of brolgas in flight, partly buried cage (protect turtle nest?) Day 13: tire and dog paw tracks on sandy beach with a dug up area (looking for turtle eggs?), black feral pig on beach, partly buried cage (to protect turtle nest?), blackened burnout grass neighbouring salt pan, pelican flying over water, dolphin and calf, person with fishing net on shore, small boat on water, photo of mangrove with a shadow of the helicopter on the water Day 14: giant milkweed growing on beach, grey mangrove saplings growing within trunks of dead mangrove trunks, flock of pelicans flying over water, old rotted mangrove tree stumps along the shoreline, mangrove forest with mixed species, many pig tracks on beach and rooting mounds, turtle tracks on beach, dust storm over salt flats, close up of shells on beach, many dead tree trunks on shoreline, dead trees covered in vines on shoreline, aerial view of wired fence going down beach into the intertidal region, three brolgas walking on beach, jabiru standing in a small lagoon near the shore, field of rotted mangrove tree stumps, large flock (> 30) of brolgas flying over mangroves and flats, brolgas on the shoreline at edge of grey mangrove forest, winding estuary lined with mangroves with large patches of die back, crocodile lying on muddy foreshore. Day 15 Both surveys were conducted during lower tidal levels where this was logistically feasible to do to gain the greatest visibility of the shoreline intertidal vegetation – positioned between the mean sea level and highest tide levels. Limitations of the data: The original aerial imagery data was reprocessed for presentation on the web. The the original aerial photos (which were 6144x4080 pixels) were down-sampled (3000x2000 pixels) and compressed (85% JPEG quality) to shrink the dataset size and make rapid previewing of the imagery much faster. This compression of the images reduced the total image dataset size from 310 GB down to 40 GB. The down-sampling resolution and compression level was chosen so that the images would retain nearly all the visual information of the original images. To allow researchers to assess whether this compression has lost key visual information, a folder on the download page (original-vs-compressed) contains a representative sample of both the original photos and their compress form is available. The original, full resolution versions of the photos is not available for direct download, but can be requested by contacting the eAtlas team via e-atlas@aims.gov.au, noting that to obtain the full dataset we would need to transfer the dataset using a hard drive. Format of the data: - Shoreline Aerial imagery: Georeferenced JPEG images (6144x4080 pixels), labelled with a Shore_FID that cross references into the Shoreline Database (Original Excel spreadsheet NESP_GOC_AerialSurveys_2017_2019.xlsx, or processed GOC_NESP-4-13_JCU_AerialSurveys_2017_2019_Shoreline_DB.shp Shapefile). The 2017 survey contains 16,706 images. The 2019 survey contains 17,161 images. Note: Only download-sampled (3000x2000 pixels) versions of this imagery are available directly through the eAtlas. - Scenic imagery: 2017: 354 JPEG files in 13 folders. 2019: 502 JPEG files in 15 folders. Note: The eAtlas makes available the original scenic images without recompression. Data dictionary: NESP_GOC_AerialSurveys_2017_2019.xlsx: TAB: Shoreline_Image_Database_17_19 - Shore_FID: Identifier of the segment along the shoreline transect. This is a continuous counter from 1 (North West of Gulf of Carpentaria) to 19534 (Western side of Cape York). Each segment is space approxiately 100 m apart. Images in the survey are aligned to the closest transect segment. This allows the repeat surveys over multiple years to be compared. - Shore_X: Longitude of the shoreline transect location. - Shore_Y: Latitude of the shoreline transect location. - Folder_2017: Path of the original imagery. This is not very useful when the data is moved. - 2017_Image: Filename of the photo from the 2017 survey. For example: 19533_2017_1_GOC_7213.JPG - Folder_2019: Path of the original imagery. This is not very useful when the data is moved. - 2019_Image: Filename of the photo from the 2019 survey. For example: 19533_2019_1_GOC_2864.JPG - 2017_Hyperlink: Link to images on disk (only works if the imagery is saved in the sample location as the original storage) - 2019_Hyperlink: Link to images on disk (only works if the imagery is saved in the sample location as the original storage) TAB: Shoreline_Observations WAYPOINT (#) - Latitude - Longitude - Date - Created - Turtle - Turtle_Track - Croc - Pig_Track - Vehicles - Net - Large_Litter - Small_Litter - Crab_Pot - Abandoned_Crab_Pot - Set_Net - Cattle_Track - Dead_Turtle - Turtle_Nest - SHARK - EAGLE_RAY - RAY - Rope - Dolphin - Dugong - Pig_Digging - Abandoned_Boat - Shorebird_Roost - SHOVELNOSE - DEAD_RAY - SAWFISH - DINGO - CURLEW - MANTA NESP_GOC_AerialSurveys_2017_2019.xlsx: TAB: Shore_DieBack_MAP - Shore_FID: ID of the location along the shoreline transect. - Image_ID_2017: Filename of the image from 2017 survey, prior to having the Shore_ID prepended to it. - Image_ID_2019: Filename of the image from 2019 survey, prior to having the Shore_ID prepended to it. - X_2017 - X_2019 - Shore_Mangrove - Density - Type - Dieback GOC_NESP-4-13_JCU_AerialSurveys_2017_2019_Shoreline_DB.shp This is a conversion of some of the information from NESP_GOC_AerialSurveys_2017_2019.xlsx into a shapefile suitable for mapping. Details of this conversion is detailed at https://github.com/eatlas/GOC_JCU_NESP-TWQ-4-13_Mangrove-Dieback_2017-2019. - Shore_FID: Shore_FID. Identifier of the segment along the shoreline transect. This is a continuous counter from 1 (North West of Gulf of Carpentaria) to 19534 (Western side of Cape York). Each segment is spaced approxiately 100 m apart. Images in the survey are aligned to the closest transect segment. This allows the repeat surveys over multiple years to be compared. - Image_ID_2017: ImgID_2017. Name of the original 2017 aerial photograph, prior to adding the Shore_FID to the image filename. - Image_ID_2019: ImgID_2019. Name of the original 2019 aerial photograph, prior to adding the Shore_FID to the image filename. - X_2017:** X_2017. ?? - X_2019:** X_2019. ?? - Shore_Mangrove: Shore_Mang. - Density: Density. - Type: Type. - Dieback: Dieback. - ImageCount: Number of survey images in each transect segment. 0 - No survey imagery, 1 - One image from either 2017 or 2019, 2 - images from both 2017 and 2019. - Division: Division of the shoreline into sections correspond to major river catchments. The Division attribute is the human readable version of the division name. - DivShort: Short version of the division name. This is used for the directories that the images are stored in. Having the images split into these regions limits the number of images per directory and allows users to download a division subsection of the imagery. - Division (DivShort) - Roper (Roper) - South-West Gulf (SW-Gulf) - Flinders-Leichhardt (FL-group) - South-East Gulf (SE-Gulf) - Mitchell (Mitchell) - Western Cape (W-Cape) eAtlas Processing: The original data was reprocessed for presentation on the web. This included down-sampling (3000x2000 pixels) and recompressing (85% JPEG quality) the original aerial photos (which were 6144x4080 pixels) so that the total image dataset size was reduced from 310 GB down to 40 GB. The down-sampling and compression was chosen so that the images retain nearly all the visual information of the original images. To allow researchers to assess whether this compression has lost key visual information a folder (original-vs-compressed) containing a representative sample of both the original photos and their compress form is available. The original, full resolution versions of the photos is not available for download, but can be requested by contacting the eAtlas team via e-atlas@aims.gov.au. Location of the data: This dataset is filed in the eAtlas enduring data repository at: data\\custodian\2018-2021-NESP-TWQ-4\4.13_Assessing-gulf-mangrove-dieback Publications: A. Existential projects ::: Independent seagrass surveys in the GOC Carter, A., S. McKenna, M. Rasheed, H. Taylor, C. v. d. Wetering, K. Chartrand, C. Reason, C. Collier, L. Shepherd, J. Mellors, L. McKenzie, N.C. Duke, A. Roelofs, N. Smit, R. Groom, D. Barrett, S. Evans, R. Pitcher, N. Murphy, M. Carlisle, M. David, S. Lui, T. S. I. Rangers and R. Coles. 2023. Seagrass spatial data synthesis from north-east Australia, Torres Strait and Gulf of Carpentaria, 1983 to 2022. Limnology and Oceanography published online: 16 pp. https://doi.org/10.1002/lol2.10352 Independent evaluations of climate conditions regards the GOC mangrove dieback event Chung, C.T.Y., P. Hope, L.B. Hutley, J. Brown and N.C. Duke. 2023. Future climate change will increase risk to mangrove health in Northern Australia. Communications Earth & Environment 4, Article 192. 8 pages. https://doi.org/10.1038/s43247-023-00852-z Abhik, S., P. Hope, H. H. Hendon, L. B. Hutley, S. Johnson, W. Drosdowsky, J. R. Brown and N. C. Duke. 2021. Influence of the 2015-16 El Niño on the record-breaking mangrove dieback along northern Australia coast. Scientific Reports 11(20411): 12 pp. https://doi.org/10.1038/s41598-021-99313-w Harris, T., P. Hope, E. Oliver, R. Smalley, J. Arblaster, N. Holbrook, N. Duke, K. Pearce, K. Braganza and N. Bindoff. 2017. Climate drivers of the 2015 Gulf of Carpentaria mangrove dieback. Australia, NESP Earth Systems and Climate Change Hub: 31 pages. JCU TropWATER Report #17/57. Independent assessment of mangrove plant physiological conditions regards the GOC mangrove dieback event Gauthey, A., D. Backes, J. Balland, I. Alam, D.T. Maher, L.A. Cernusak, N.C. Duke, B.E. Medlyn, D. T. Tissue and B. Choat. 2022. Natural water-availability gradient accentuates the risk of hydraulic failure in Avicennia marina during physiological drought. Frontiers Plant Science 13: 822136. https://doi.org/10.3389/fpls.2022.822136 Independent evaluation of marine fisheries debris observed along GOC shorelines Hardesty, B. D., L. Roman, N. C. Duke, J.R. Mackenzie and C. Wilcox. 2021. Abandoned, lost and derelict fishing gear ‘ghost nets’ are increasing through time. Marine Pollution Bulletin 173 (112959): 10pp. https://doi.org/10.1016/j.marpolbul.2021.112959 Independent evaluation with global examples of ecosystem decline includes the mass dieback of GOC mangroves Bergstrom, D. M., B. C. Wienecke, J. van der Hoff, L. Hughes, D. L. Lindemayer, T. D. Ainsworth, C. M. Baker, L. Bland, D. M. J. S. Bowman, S. T. Brooks, J. G. Canadell, A. Constable, K. A. Dafforn, M. H. Depledge, C. R. Dickson, N. C. Duke, K. J. Helmstedt, C. R. Johnson, M. A. McGeoch, J. Melbourne-Thomas, R. Morgain, E. N. Nicholson, S. M. Prober, B. Raymond, E. G. Ritchie, S. A. Robinson, K. X. Ruthrof, S. A. Setterfield, C. M. Sgro, J. S. Stark, T. Travers, R. Trebilco, D. F. L. Ward, G. M. Wardle, K. J. Williams, P. J. Zylstra and J. D. Shaw. 2021. Ecosystem collapse from the tropics to the Antarctic: an assessment and response framework. Global Change Biology 27: 1692-1703. https://doi.org/10.1111/gcb.15539 Harris, R. M., L. J. Beaumont, T. Vance, C. Tozer, T. A. Remenyi, S. E. Perkins-Kirkpatrick, P. J. Mitchell, A. B. Nicotra, S. McGregor, N. R. Andrew, M. Letnic, M. R. Kearney, T. Wernberg, L. B. Hutley, L. E. Chambers, M. Fletcher, M. R. Keatley, C. A. Woodward, G. Williamson, N.C. Duke and D. M. Bowman 2018. Linking climate change, extreme events and biological impacts. Nature Climate Change 8(7): 579-587. DOI: 10.1038/s41558-018-0187-9. Author Correction: Nature Climate Change 8(9): 1; DOI: 10.1038/s41558-018-0237-3. B. NESP project reporting ::: Duke, N.C., J.R. Mackenzie, A.D. Canning, L.B. Hutley, A.J. Bourke, J.M. Kovacs, R. Cormier, G. Staben, L. Lymburner and E. Ai. 2022. ENSO-driven extreme oscillations in mean sea level destabilise critical shoreline mangroves – an emerging threat with greenhouse warming. PLOS Climate 1(8), 23pp. https://doi.org/10.1371/journal.pclm.0000037. Duke, N.C. 2022. Climate change killed 40 million Australian mangroves in 2015. Here’s why they’ll probably never grow back. The Conversation: online. 28 July 2022. https://theconversation.com/climate-change-killed-40-million-australian-mangroves-in-2015-heres-why-theyll-probably-never-grow-back-166971 Duke, N.C., L.B. Hutley, J.R. Mackenzie, D. Burrows. 2021. Processes and factors driving change in mangrove forests – an evaluation based on the mass dieback event in Australia’s Gulf of Carpentaria. In: ‘Ecosystem Collapse - and Climate Change’, editors: Josep G. Canadell and Robert B. Jackson, Springer, Ecol. Studies 241: 221-264. https://link.springer.com/chapter/10.1007/978-3-030-71330-0_9 Duke, N.C., Mackenzie, J., Kovacs, J., Staben, G., Coles, R., Wood, A., & Castle, Y. 2020. Assessing the Gulf of Carpentaria mangrove dieback 2017–2019. Volume 1: Aerial surveys. Report to the National Environmental Science Program. James Cook University, Townsville, 226 pp. https://nesptropical.edu.au/wp-content/uploads/2021/05/Project-4.13-Final-Report-Volume-1.pdf Duke, N.C., Mackenzie, J., Hutley, L., Staben, G., & Bourke, A. 2020. Assessing the Gulf of Carpentaria mangrove dieback 2017–2019. Volume 2: Field studies. Report to the National Environmental Science Program. James Cook University, Townsville, 150 pp. https://nesptropical.edu.au/wp-content/uploads/2021/ 05/Project-4.13-Final-Report-Volume-2.pdf Duke, N.C. 2020. Mangrove harbingers of coastal degradation seen in their responses to global climate change coupled with ever-increasing human pressures. Human Ecology Journal of the Commonwealth Human Ecology Council – Mangrove Special Issue 30: 19-23. https://www.checinternational.org/wp-content/uploads/2020/06/Journal-30-Mangroves.pdf Duke, N.C., C. Field, J.R. Mackenzie, J.-O. Meynecke and A.L. Wood. 2019. Rainfall and its possible hysteresis effect on the proportional cover of tropical tidal wetland mangroves and saltmarsh-saltpans. Marine and Freshwater Research 70(8): 1047-1055. DOI: 10.1071/MF18321. Van Oosterzee, Penny, and Duke, Norman 2017. Extreme weather likely behind worst recorded mangrove dieback in northern Australia. The Conversation, 14 March 2017, online. pp. 1-6. http://theconversation.com/extreme-weather-likely-behind-worst-recorded-mangrove-dieback-in-northern-australia-71880 Duke, N. C., J. M. Kovacs, A. D. Griffiths, L. Preece, D. J. E. Hill, P. v. Oosterzee, J. Mackenzie, H. S. Morning and D. Burrows. 2017. Large-scale dieback of mangroves in Australia’s Gulf of Carpentaria: a severe ecosystem response, coincidental with an unusually extreme weather event. Marine and Freshwater Research 68 (10): 1816-1829. http://dx.doi.org/10.1071/MF16322 Duke, N.C. 2017. Climate calamity along Australia's gulf coast. Landscape Architecture Australia 153: 66-71. https://landscapeaustralia.com/articles/february-issue-of-laa-out-now-1/# Duke, N. C. 2016. Huge mangrove die-off in Australia. Nature 535: 204. http://dx.doi.org/10.1038/535204a Duke, N.C. 2021. Assessing mangrove dieback in the Gulf of Carpentaria. National Environmental Science Program, Northern Australia Environmental Resources and Tropical Water Quality Hubs, Wrap-up factsheet, 6 pages. https://nesptropical.edu.au/wp-content/uploads/2021/05/Project-4.13-Wrap-up-Factsheet.pdf Duke, N.C. 2021. Facilitating natural regeneration processes: Planting seedlings is not the best response to mass mangrove dieback in the Gulf of Carpentaria. Report to the National Environmental Science Program. Reef and Rainforest Research Centre Limited, Cairns, 8 pages. https://nesptropical.edu.au/wp-content/uploads/2021/08/Project-6.2-Case-Study-Booklet-1-Mangroves_COMPLETE_FINAL2.pdf Duke, N.C., Mackenzie, J. 2020. Assessing the Gulf of Carpentaria mangrove dieback 2017–2019: Summary report. James Cook University, Townsville (41pp.). 55 pages. https://nesptropical.edu.au/wp-content/uploads/2021/05/Project-4.13-Summary-Report.pdf Duke, N.C. 2020. Assessing mangrove dieback in the Gulf. National Environmental Science Program, Northern Australia Environmental Resources Hub, Start-up factsheet, 4 pages. https://nesptropical.edu.au/wp-content/uploads/2020/01/Mangrove-dieback-start-up-factsheet_NAER.pdf Duke, N.C. 2019. Assessing mangrove dieback in the Gulf of Carpentaria. National Environmental Science Program, Northern Australia Environmental Resources Hub, Project Update June 2019, 2 pages. https://nesptropical.edu.au/wp-content/uploads/2020/01/Mangrove-dieback-update-June-2019-1_NAER.pdf Duke, N.C. 2019. Assessing the Gulf of Carpentaria mangrove dieback. National Environmental Science Program, Tropical Water Quality Hub, Factsheet, 2 pages. https://nesptropical.edu.au/wp-content/uploads/2019/04/NESP-TWQ-Project-4.13-Factsheet.pdf